About
President Lola W. Brabham
Staff
Board of Trustees
Member Colleges and Universities
Council of Governing Boards
Advocacy
History
Advocate for Student Aid
Data & Research
News & Events
Annual Meeting
Calendar
Partners
Affiliates
Collaborative
NYGEAR UP
Search
Your College Search
Menu
Search
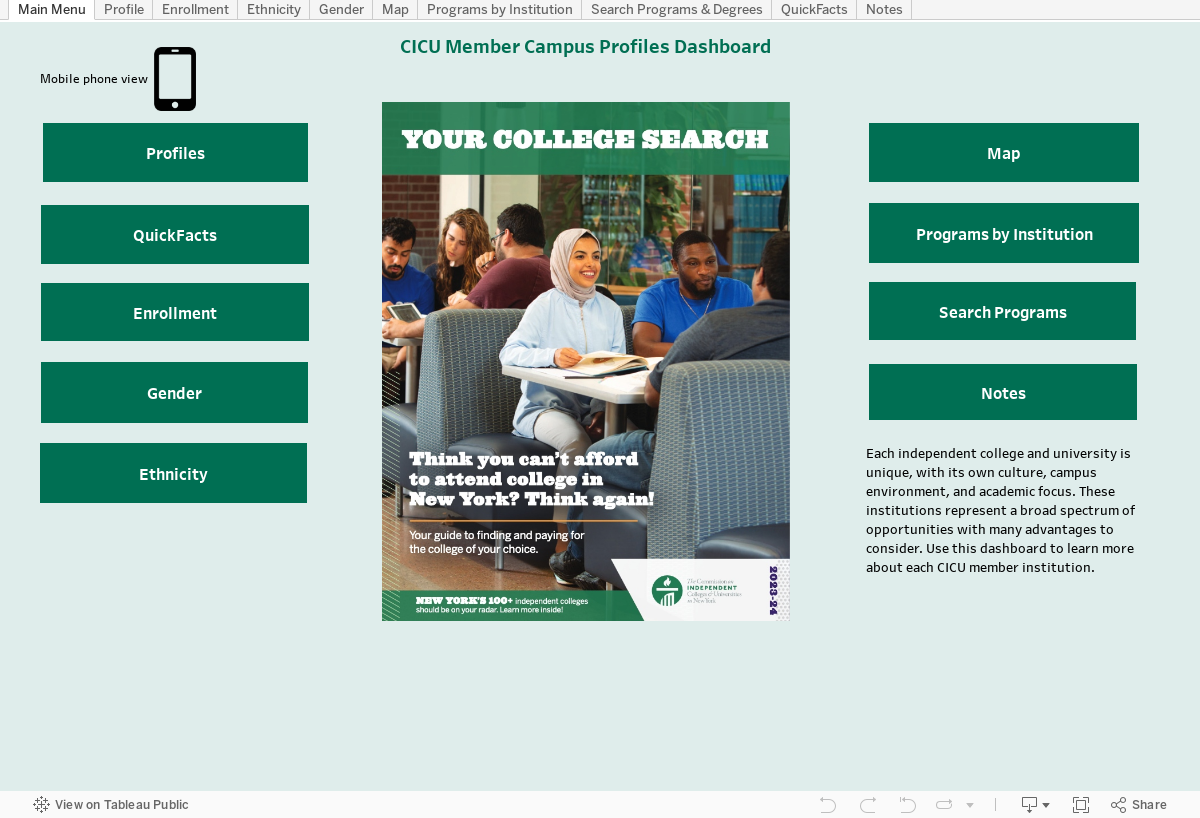
Your College Search
Your College Search
About
President Lola W. Brabham
Staff
Board of Trustees
Member Colleges and Universities
Council of Governing Boards
Advocacy
History
Advocate for Student Aid
Data & Research
News & Events
Annual Meeting
Calendar
Partners
Affiliates
Collaborative
NYGEAR UP
A private college education is worth considering—and we have the numbers to prove it.
How to Plan For College
How to Pay For College
How to Pick A College
Download this year's Your College Search
Order The 2023-24 Your College Search Book & Postcard
to top